Real Estate is Local: How Our Local Market Compares with national trends

Dani Fleming
Dani Fleming, the principal of MA Properties, has been involved in real estate for many years...
Dani Fleming, the principal of MA Properties, has been involved in real estate for many years...
There is much discussion going on in the media about what is happening nationally, and what the outlook is, with the real estate market. It's important to understand that "real estate is local". So, how do our local markets compare with the national picture?
Inventory?
Nationally there is talk that inventory levels are increasing. What's happening here?
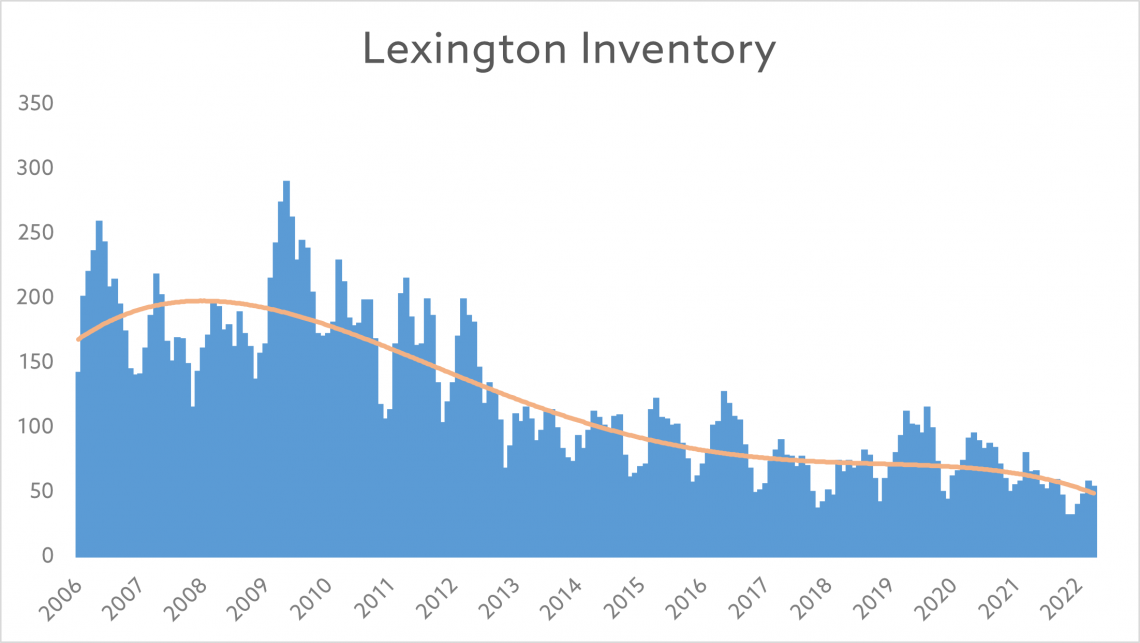
Each data point in the graph below shows how many homes are available to buy at the beginning of the month since 2007 for one of the towns in the area, Lexington. The absolute numbers matter less than the overall trend, so we've added a trend line through the Lexington data. As you can see after stabilizing from 2013 through 2019, it has been decreasing in 2021 and 2022, and its currently at the lowest levels we have ever seen. We're not seeing signs of the 'turning point' referenced above for the local housing markets.
For Inventory for additional towns see: Inventory Levels
Home Sales - Rising or Falling?
Nationally existing-home sales fell for the third straight month in April 2022, to a seasonally adjusted annual rate of 5.61 million. Sales were down 2.4% from the prior month and 5.9% from one year ago. In the Northeast this fall was -10.7%.
Locally we see a more mixed picture with some towns with lower homes sales and some with higher. If we look at the historic homes sales for Lexington we see them at all-time high levels for the past 2 years.
For Yearly Total Home Sales for additional towns see: Yearly Total Home Sales
When we look at the real-time data for 2022 we see that we are on-track to see less sales in 2022 (following the national trend). The key question we are asking is "is this caused by a slowing housing market or rather that discretionary sellers had taken advantage of the high prices and sold in 2021 and 2022, and we are now returning to the historic norms"?
For Cumulative Home Sales Comparison for additional towns see: Cumulative Home Sales Comparison
Home Prices - Rising, Falling, or Staying Steady?
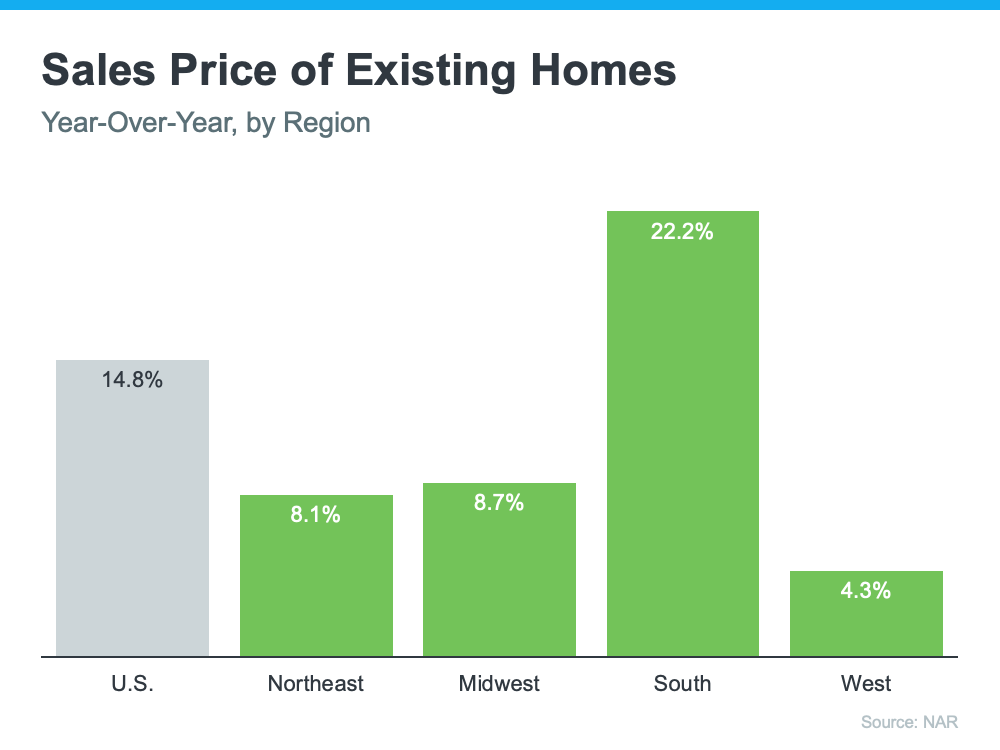
This is the metric that all home seller (and buyers) care about. Nationally we see an almost 15% rise year-on-year. The majority of this rise is in the South, while the Northeast saw a more modest 8.1% rise.
Locally we see a more mixed picture with almost every town showing positive price appreciation. It's worth noting that some towns are seeing very high price appreciation. For example, Arlington's average prices have increased by 22% in 2022 compared to 2021. Arlington has a great commute, great school district and is a vibrant, community centric town so its no wonder that it is appealing to buyers and prices are appreciating rapidly.
Acton saw high price appreciation in 2021 which is a result of buyers being less concerned with the commute to Boston and favoring the affordability of single family homes, and the great schools, in the town.
For Average Home Prices for additional towns see: Average Home Prices
Homes with price adjustments prior to selling
According to Altos Research, a strong leading indicator of the strength of the housing market in a particular area is the percentage of homes that have a price adjustment prior to selling. Their research shows that nationally, in a normal market, approximately 33% (a third) of homes reduce their asking price before selling. Remember though, that this is an average number for the whole of the US. Many markets will have a lower percentage - for example, in the most desirable CA markets the normal value is closer to 18-20%.
In the very strong (sellers market) of 2020/2021 the national average dropped to 15%.
Recent home sales in 2022 show that this national average has now risen to 22% - indicating that more sellers are forced to adjust the asking price of their home in order to sell, and that the real estate market is cooling somewhat with the increase in mortgage interest rates.
Remember though this is average for the US.
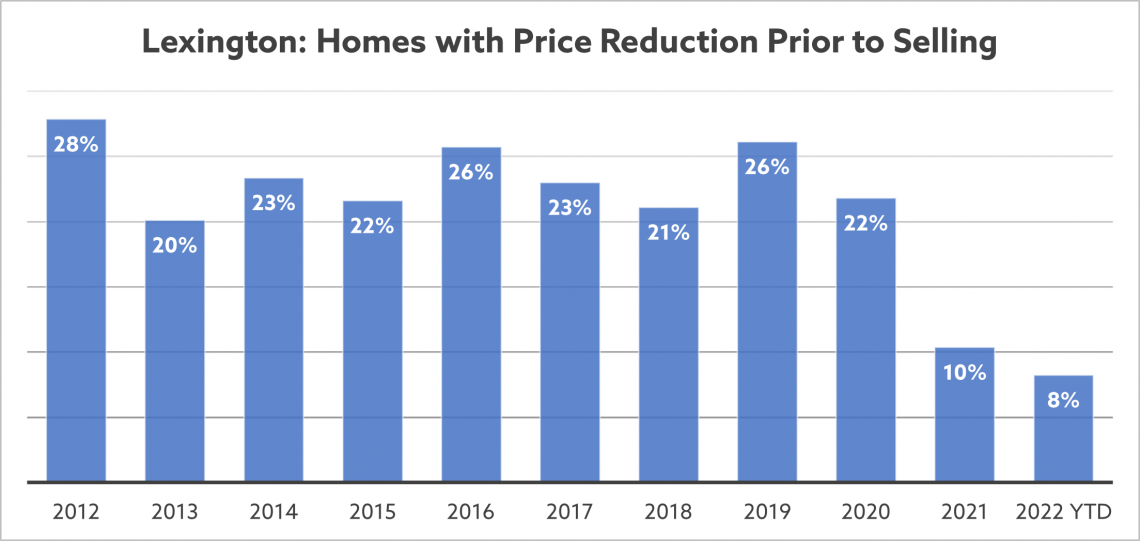
Locally, the 'normal' value of the percentage of price adjustments prior to selling for Lexington is approximately 25% (less that the national average of 33%). This decreased slightly in 2020 to 22%, but dropped sharply in 2021 to 10%. The year-to-date data for Sold and Under Agreement transactions shows that 8% of homes adjusted their asking price prior to accepting an offer. Its clear that data in our local markets does not follow the same trending characteristics that is being seen in the national percentages of this leading indicator of the strength of the real estate market.
Real estate is local. The national trends are interesting to look at but when it comes to your home, in your town, you have to look closely at the data to see what's happening locally.
For much more data showing what is happening in our local markets, for approx 50 different towns: Statistics
What's Going on
Closer to Home?
If you're wondering how real estate activity over the last two years has impacted your home's value, click below to get started with your free evaluation.