Understanding the Real Estate Market in a town
Understanding the health of the real estate market in a town is important to everyone living in a town, or considering buying in that town. This newsletter will explain the various metrics available that can help you understand what is happening with the real estate market in your town.
Probably the only people who are not interested in understanding the health of a real estate market in a town are renters who have no interest now, or in the future, of buying a home. Everyone else has some level of desire to understand what is happening either in the town they are planning on moving to, or the town they currently live in. There are various methods you can use to gain an understanding of the market, some better than others. You can become an active real estate agent in your market, or you can review the statistics on a regular basis and watch the home sale activity in your market.
This blog post will focus on Lexington as the town to review. Similar reviews can be done on your town by reviewing the data available on our website.
In Massachusetts, real estate 'health' is very much a town-specific variable. Much of this is based on the quality of the school system and the commute distance into Boston - both of which play an important part in a buyers decision to move to a town, or move within a town. The desirability of Lexington as a town to move to is greatly enhanced due to the high quality school system and the proximity to Cambridge and Boston. Both locations are easily accessible by car or public transportation. Often folks relocating to Massachusetts identify Lexington as their first priority as a location before they have even visited the state.
Demand for housing in Lexington is increasing dramatically, and has been steadily increasing over the last couple of years, and is exacerbated with declining inventory levels. It is not uncommon, and is increasingly more common, for multiple offer situations on homes that have come on the market priced realistically.
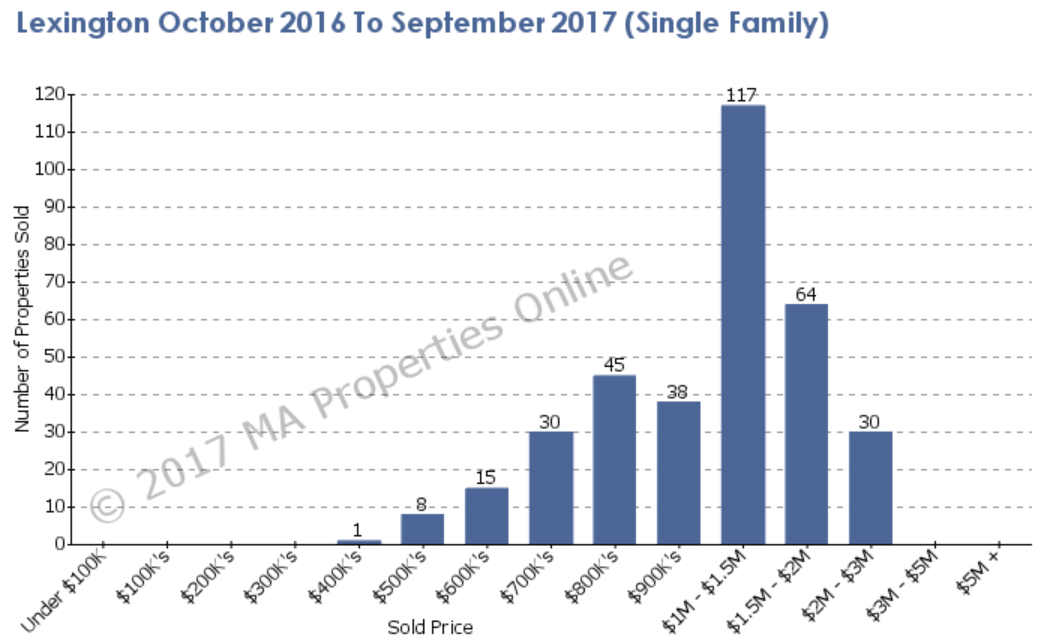
One of the pieces of data that buyers use to evaluate if a town is 'right' for them is to understand the distribution of sales, over a period of time, in a town. This is an important piece of information as its important to know if the price you are anticipating spending is far over what is typical in that town, or whether it is unlikely you will find a home at the price you want to pay.
The distribution of sales in Lexington for the last 12 months is shown above. It is easy to see where the majority of sales in this town occur - its in the $1M-2M price range. If you had $1.5M to spend you can be assured that if you buy in Lexington you are buying in a town that can support your investment. Equally if you were looking for a home in the $400,000 range you might be dismayed at how few homes there are sold in that price range indicating a distinct lack of inventory. Its interesting to note that the highest number of sales occurs between the $1-2M range, and we know that a lot of those homes are new construction, which correlates with the $500K price range, of which a large number are smaller homes that are purchased by builders looking to build new construction on the lot.
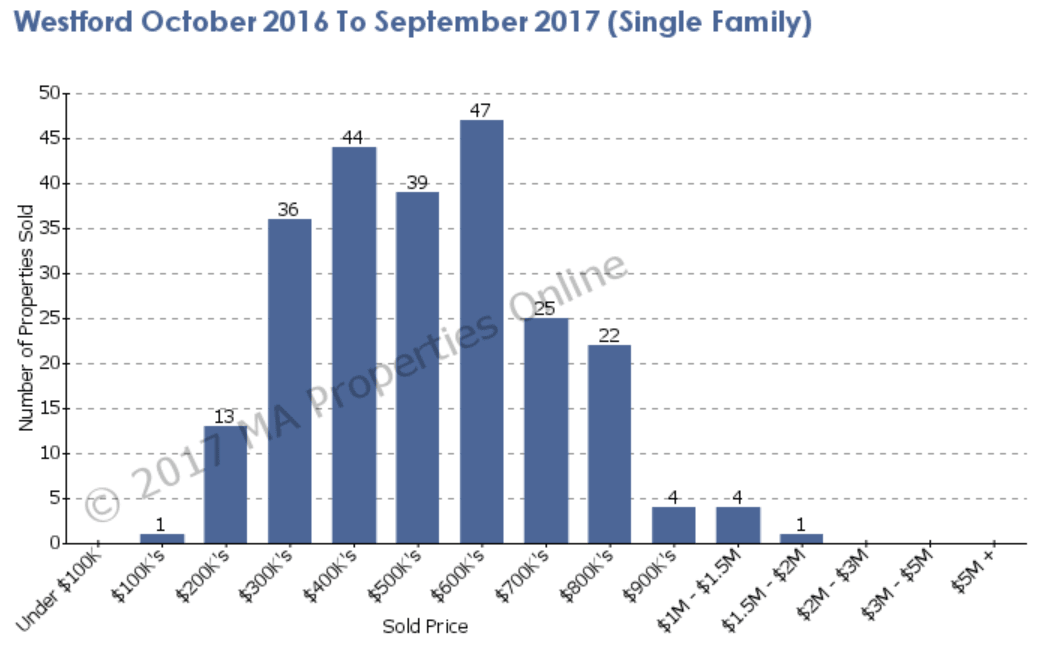
Comparatively, if you look at the distribution of sales in Westford (below), you can see that there are very few homes sold in the $1-2M range in this town in the last 12 months, so this may not necessarily be a good place to spend $1.5M on a home as you would more than likely be one of the most expensive homes in the town. If you had $400,000 to spend then this would be a feasible town for you to buy in because the largest number of homes sold in this town in the last 12 months is in this price range, indicating that there will be a number of homes in your price range on the market, or coming onto the market.
So, without even having physically 'stepped foot' in the town you have a better understanding of the make-up of homes and values of those homes within the towns purely by reviewing the distribution of sales over the prior 12 months.
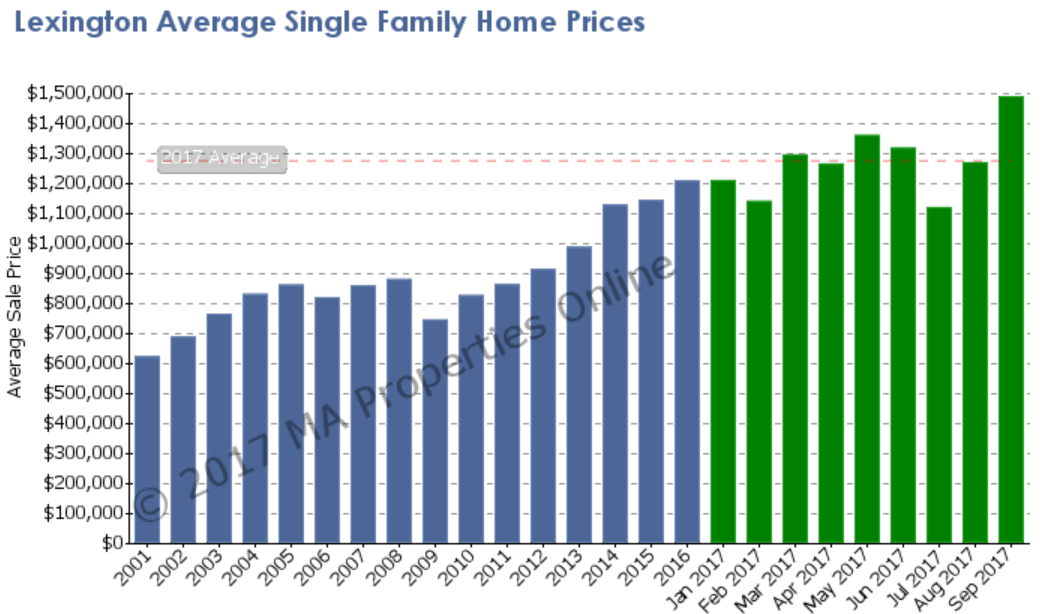
Another important and valuable piece of information is the Average Home Prices within a town. It can begin to give you an idea of the trends occurring within a town, and comparatively, with other towns. The blue bars in the graph represent the average home price for that year, and the graph shows average home prices since 2001. The green bars show average home prices for each month of the current year.
In Lexington you can see that the Average Home Price has been steadily increasing since the bottom of the market in 2009. In fact, the average home price in 2016 is the highest average home price achieved in Lexington over the last 10 years, indicating that we have well and truly rebounded from the downturn in the real estate market that has been seen nationally earlier in the decade.
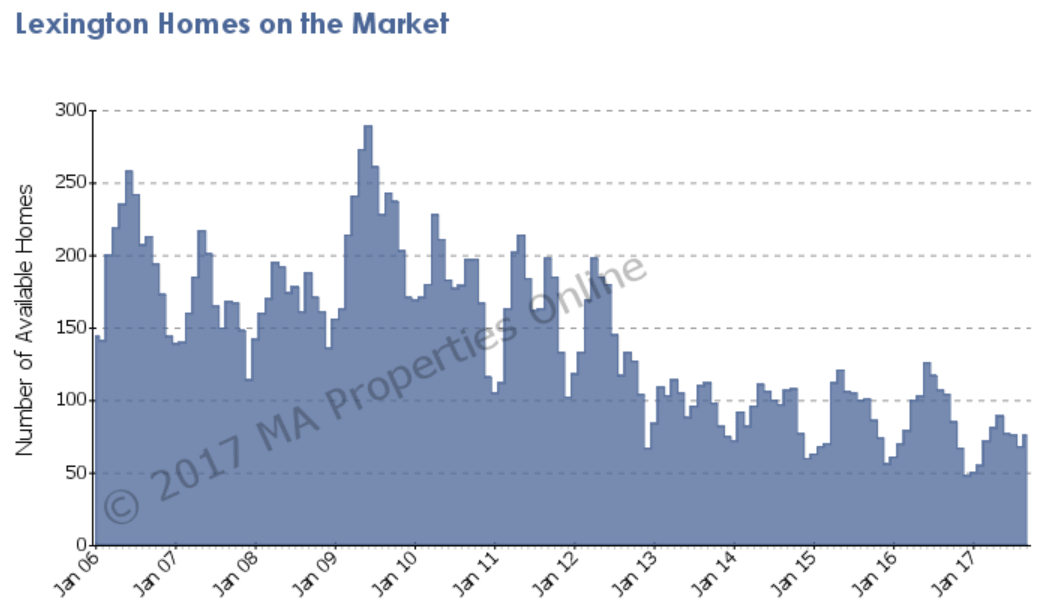
The graph below shows the movement of inventory (homes on the market) over the last 11 years in Lexington. This graph can tell you many things. Note the seasonality reflected in the graph - in Jan 2013 inventory levels were very low, and as the spring market got underway inventory levels began increasing as more homeowners put their home on the market to sell. In May 2013, the number of homes on the market peaked and then began dropping as fewer sellers decided to sell and started thinking about their summer plans instead, yet buyers remained very active. The net result of fewer homes coming on the market, yet buyer activity continuing, is a reduction of homes available for sale. In July and August inventory levels hovered below the peaks of spring and autumn with occasional homes coming on the market and occasional purchases occurring. But, most buying and selling activity slows down during the summer months, increasing again in autumn when sellers and buyers again think about moving. The autumn market is shorter than spring, starting around September and finishing by Thanksgiving. After Thanksgiving many home sellers take their homes off the market for winter because of reduced buyer activity and this also means that they can bring their homes back on the market again in spring, fresh to the market. You can see the repeat of this scenario year after year, indicating a balanced cycle. In spring of 2009 we had very high peaks of inventory, but with subsequent lower peaks in the following years.
Seasonality in an inventory level graph indicates a 'healthy' market. When you are in an area with lots of foreclosures, short sales and oversupply of homes you don't see seasonality of this type because the seasonal trends are 'hidden' among the clutter of the oversupply.
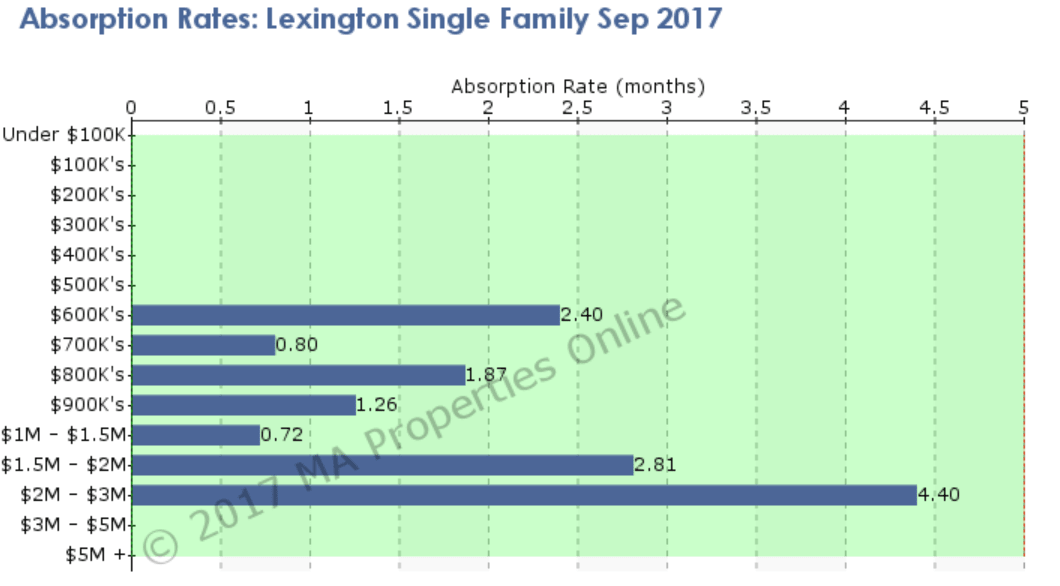
Absorption rates tell us a huge amount of information about the current real estate market in a town. Using the sales data for the last 12 months, at any given price range, you can derive the rate of sales per month. The absorption rate calculates how many months it will take to sell the current inventory, assuming no more houses come on the market, at the same rate of sales that occurred in the prior 12 months. In other words, how many months will it take to sell what we have on the market? We generally say that any price range that has over 7 months supply has an 'oversupply' situation and can be characterized as a buyers market. Any price range under 7 months is in a balanced, 'healthy' state, and where we have less than 3 months supply we are in a 'greater demand than supply' situation indicating a sellers market. Note though that these figures change daily and this graph is just one point in time, typically the first day of the month. In winter when there is very little inventory on the market you tend to have 'better' absorption rates than in the peak of spring where a lot of homes have entered the market.
Reviewing Lexington's absorption rates we can see that in every price range we are in a severe shortage of inventory. Absorption rates show us that below the $1M price point we have very little supply. Over $2M we are seeing a larger supply of homes available and that given the same rate of sales over the past 12 months, it would take just over 4 months to sell the available inventory indicating a balanced market in the town at this price range. In virtually every price range we are experiencing multiple offers on homes if they've come on reasonably priced. One of our homes recently had over 20 offers on it, and others, in competing offer situations, are going for well over asking price.
Its important to continue to watch the trends that the data provide us to gain a fuller understanding of the overall health of the market. Using these same statistical pieces of information you can evaluate the health of the real estate market in any town that you have the information.
If you have any questions about any of this then please don't hesitate to reach out to one of us. We would be more than happy to help.


