Home  >  Communities  >  Lexington  >  Lexington Market Review  >  Single Family Home Market Summary

Summary

If 2022 was a “game of two halves” 2023 offered an overtime with more of the same. 2023 was impacted by rising mortgage interest rates – this caused sellers to postpone moving and buyers to pull back as they saw rates rise between getting a pre-approval and getting an accepted offer on a home. In some instances, this increase in borrowing costs caused buyers to exit contracts as repayment costs were simply too high.

Looking back at our 2022/2023 Market Review our two key predictions for 2023 were firstly the normal cycle of downsizing, move-up, and relocating sellers will continue with similar number of homes sales as we saw in 2022, and secondly, there is some hesitancy with buyers with mortgage rates still over 6% and uncertainty over the medium-term market condition and price appreciation. This hesitancy will subside as mortgage interest rates decline as the year unfolds.

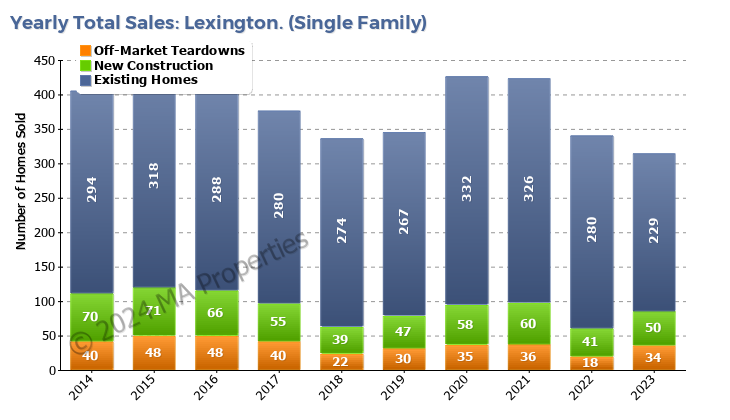
The continued high interest rates negatively impacted both predictions. The total number of homes sales in 2023 was lower than in 2022 as sellers postponed selling to avoid a large increase in their mortgage monthly repayments. The second prediction hinged on reduced interest rates as 2023 unfolded. The anticipated reduction did not occur until Q4 2023 and so had minimal impact on the overall 2023 housing market.

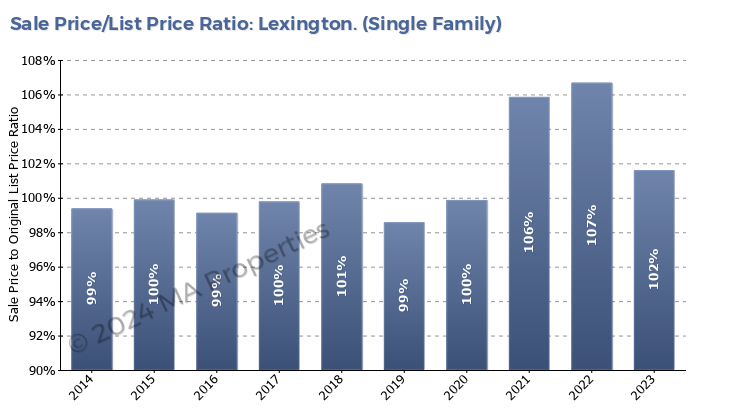
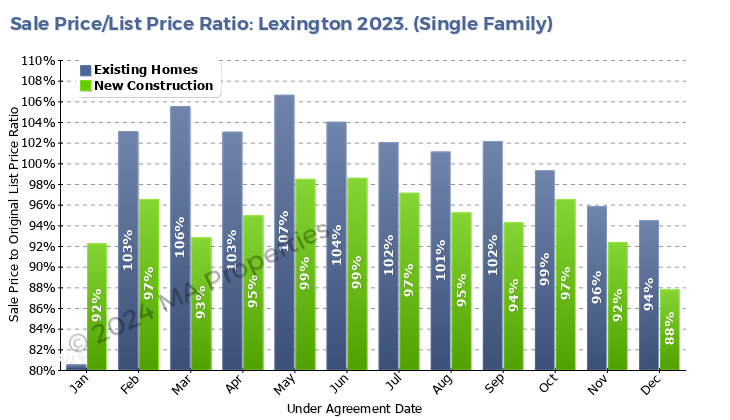
Given these characteristics many of the key performance metrics – days on the market and sale price/list price ratio - showed a relatively weak market in 2023. But closer examination shows a noticeable decline in these metrics as the second half of the year unfolded and the prospects of a substantial mortgage rate reduction declined. The sale price/list price ratio peaked at 106% in May (it was 116% in May 2022) and was at 102% for the full year, but it was at about 100% per month throughout the second half of the year.

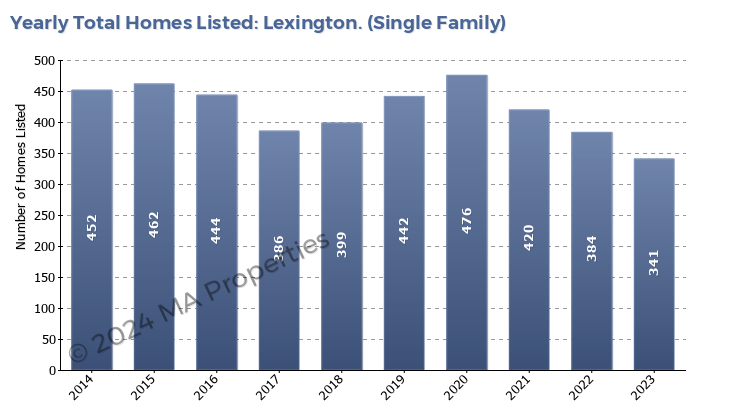
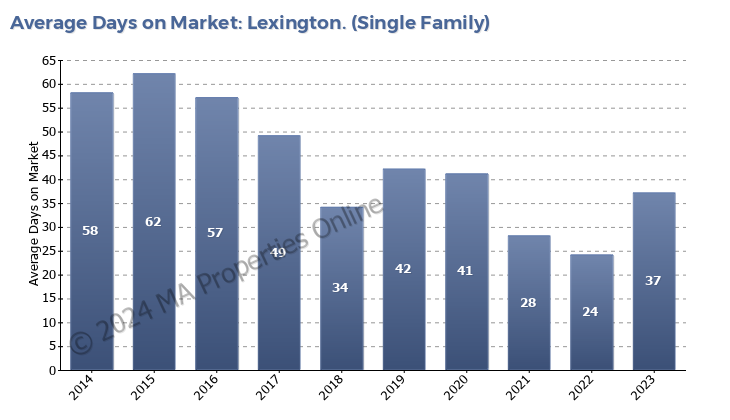
How should we view these numbers? Home sales were lower than anticipated but are on track to revert to 2018/2019 levels (as anticipated with the decline of the COVID effect). A 100% sales price/list price ratio was the value seen through each year from 2013-2020 and the 2023 value of 102% reinforces the prospect of a reversion to 2018/2019 market conditions. Days on the market were consistent throughout the year at about 37 days (2022 value was 24 days). And so, if we view these against the gloom and doom of the national real estate market it’s clear that the Lexington market weathered the market turmoil caused by the rapid rise in mortgage interest rates well. Proving that the adage ‘Real Estate is local’ is accurate.

As we look forward what will 2024 bring? Mortgage interest rates are moving downwards with 6.1% predicted by the end of the year and so with more sellers and less hesitant buyers we predict that the overall housing market will revert to the stable market condition seen prior to the COVID years of 2020 and 2021.

Sellers

It is a more challenging picture for sellers than we have seen in recent years. A decrease in supply usually means that buyers compete for homes creating a strong seller’s market. But 2023 saw very hesitant buyers in the market because of high interest rates combined with the high price appreciation seen in 2020 and 2021. But, with declining interest rates set to continue throughout 2024 we anticipate more sellers entering the market as they decide to “get off the fence” and move, chasing interest rates down (through refinancing). With the increasing number of sellers competition will increase and so, to get the maximum price for your home sellers need to focus on the fundamentals when selling – ‘move in’ ready, great staging, a comprehensive marketing strategy (utilizing both digital and traditional channels), and the right pricing strategy to attract the buyers who are looking to buy.

Buyers

While not as strong a sellers’ market as we have seen in prior years, the housing market in Lexington will continue to be challenging for buyers. The market will be characterized by moderate inventory, similar price levels to 2023, and relatively high mortgage interest rates. So, when the right opportunity arises, buyers must be prepared to act quickly and decisively. It is key to work with an agent who both understands and can educate you on the Lexington market, provide advice on the pros and cons of the home and resale potential of the home, and is able to assist you in structuring a competitive offer.

Homes Listed

The number of homes listed has been declining since 2020 as COVID effects declined and the market reverted to the normal cycle of downsizing, move-up, and relocating sellers. The number of homes listed in 2022 was 384 – consistent with the market condition seen prior to the COVID years of 2020 and 2021. The number of homes sales declined 11% in 2023 to 341 because of continued high mortgage interest rates and the associated reluctance of sellers to swap the very low mortgage rate on their current home for a higher mortgage rate on their next home.

Homes Sold

The number of homes sold in 2022 was 321 – consistent with the market condition seen prior to the COVID years of 2020 and 2021. The number of homes sales declined 13% in 2023 as noted above because of continued high interest rates and the associated reluctance of sellers to swap the very low mortgage rate on their current home for a mortgage rate of over 6% on their next home. But the reduction in homes sales was greater than the reduction in the number of homes listed, showing the reluctance (and in many cases the inability) of buyers to buy because of the high interest rates.

The number of “homes listed” is lower than the number of “homes available to buy” because many homes that were listed in 2022 failed to sell in 2022 and remained “on the market” into 2023. These unsold homes amount to approximately a 6% increase in the number of homes available to buy over the number listed, further highlighting the reluctance of buyers to buy because of the high interest rates.

Sale Price to List Price Ratio

One of the strongest indicators of demand is the ratio of the sales price to the list price. An average ratio of over 100% means that, on average, there was competition, resulting in buyers competing to buy the home and paying more than the asking price. The Lexington market has seen this indicator at approximately 100% throughout 2013-2020. COVID and the ensuing widespread re-evaluation of what homeowners required in a home saw this indicator rise to 106% in 2021. This high value is indicative of a very strong seller’s market. 2022 saw this indicator rise further to 107% when we aggregate over the full year. 2023 saw the metric decline (consistent with the second half of 2022) to 102%.

Sale Price to List Price Ratio (Monthly/NC)

Breaking down the Sales Price to List Price Ratio by month and property type shows two noticeable aspects of the housing market. Overall, the ratio declined from June through December. This was caused by mortgage interest rates increasing in Q3 and the realization that mortgage interest rates were not going to decline to 5% at year-end as predicted 12 months previously. The ratio for new construction homes was lower than for existing homes. This was caused by an over-supply of new construction homes in 2022 and developers being forced to reduce prices (developers, unlike many homeowners, cannot delay listing due to changing market conditions).

Average Days on Market

Another indicator of demand is the length of time homes are on the market, known as “Days on Market”. Homes were on the market for an average of 37 days in 2023 before going under contract, compared to 28 and 24 days in 2021 and 2022. It is important to note that this is an aggregate number covering all price points. Lower price points, below $2M, saw numbers closer to 22 days. Higher price points, above $2M, saw numbers closer to 86 days.

Average Sale Price

Average prices increased to just over $1.8 million in 2023, an increase of 6% over 2022 prices. In prior years we noted that some caution was needed when drawing conclusions from these price appreciation numbers because of changes in the sale price distribution. This was also the case this year because we saw a decrease in the number of existing home sales and an increase in the number of new construction home sales as developers reduced prices to offload homes. Based on this, 6% should be considered very high. The average new construction home price declined in 2023 to $2.8 million and 1-2% is the adjusted price appreciation for existing homes.

Sale Price Analysis

Splitting average sale price by new construction and existing homes shows the shows two price appreciation trends. New construction prices rose sharply in 2021 and 2022 but corrected downwards in 2023 because of over building in 2022.

Existing homes price appreciation rose sharply in 2022 and 2021 but slowed markedly in 2022 and 2023 as the effects of interest rate rises impacted buyer's affordability.

We use cookies to enhance your browsing experience and deliver our services. By continuing to visit this site, you agree to our use of cookies. More info