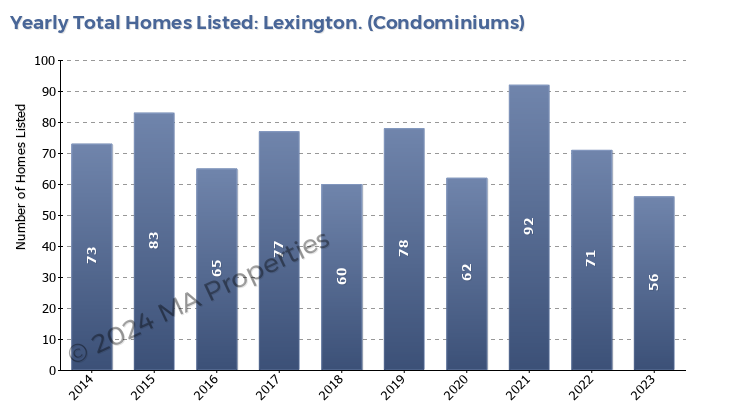
Home  >  Communities  >  Lexington  >  Lexington Market Review  >  Condominium Market Summary

Summary

The condominium market is small when compared to the single-family home market with 55 condominiums selling in 2023 compared to 279 single family homes. There are few standalone condominiums (for example in 2 or 3 family dwellings) in Lexington. Both existing and new construction condominiums tend to be grouped into “communities” that offer many shared services. Providing these services typically raises the condominium fees.

Condominiums Listed

The number of condominiums listed in 2023 was 56 compared to 71 in 2022. The difference can be explained because there were very few new construction condominiums listed in 2023 and the Lilly Pond Lane new construction project completed in 2022. Given that the single-family market saw an 11% reduction in homes listed due to sellers postponing their sale, we can see that condominium sellers continued to list. One reason for this is perhaps that condominiums are often seen as a steppingstone to a single-family home and the reduced living area of the condominium compared to single family homes forced many homeowners to move as the home no longer met their requirements.

Condominium Sales

The number of condominiums sold in 2023 was 55 compared to 64 in 2022. The sales are generally split into two groupings. The older developments – Potter Pond (1980’s), Fifer Ln/Drummer Boy Way (1970’s), Emerson Gardens (1960’s) etc. and the newer developments – Lilly Pond Lane (2021/2022), Jefferson Dr (2019/2020), Robinson Rd (2018) etc. Given this split, in prior years, we see a relatively static number of existing condominium sales with the new development communities driving the peak in sales volume when they come on the market.

Sales Price to List Price Ratio

One of the strongest indicators of demand and realistic pricing is the ratio of the sales price to the list price. An average ratio of over 100% means that there was competition, resulting in buyers paying more than the asking price. The Lexington condominium market has seen this indicator at approximately 100% throughout 2013-2021. 2022 saw this indicator rise to 104% when we aggregate over the full year. This is not the full story though. As noted previously, the second half of 2022 was considerably weaker than the first half and is being masked by aggregating over the full year. Looking at the ratio for 2023 we can see it declined to 102%. For comparison the ratio for single-family homes was also 102% in 2023.

Average Days on Market


Average Sale Price (Existing Condos)

Between 2017 and 2020 the average sales price for existing condominiums showed a worrying trend. We saw a 5% reduction in the average sales price in this period. Prices did rebound in 2021 and this has continued into 2023, continuing the H2 2022 trend. The average price of an existing condominium in 2023 was just over $885,000, an increase of just over 3% compared to 2022.
We believe that high condominium association fees were the key reason for the poor performance of the condominium market in the 2017 to 2020 time period. If we compare the Lexington to Arlington condominium markets – average sale price and average floor area are comparable – but, the average condo association fee in Lexington is over double the corresponding average fee in Arlington. With the effects of COVID diminished and stability returns to the housing market we expect the slower price appreciation to return in the condominium market.

We use cookies to enhance your browsing experience and deliver our services. By continuing to visit this site, you agree to our use of cookies. More info